Plant Manager
Help Guide
Everything you need to know about tracking plants, clones, feedings, harvests, and more in the Tropical Roots Maui Plant Manager.
- Getting Started
- Header & Settings
- Dashboard
- Plants
- Environments
- Clones
- Tasks
- Feeding
- Photo Journal
- IPM (Pest & Disease)
- Harvest
- Strains & Catalog
- Analytics
- Calendar
- Environment Readings
- Tools & Extras
- Data & Backup
- Install as App (PWA)
- Accessibility
- Privacy & Search Indexing
- Keyboard Shortcuts & Command Palette
- Frequently Asked Questions
First Steps
Plant Manager runs entirely in your browser and keeps your data right there, in localStorage. There's no account to make and nothing to install. Open tracker.tropicalrootsmaui.com and start adding plants.
A good order to start in:
- Add an environment for your grow tent, room, or outdoor space, over on the Environs tab.
- Add a mother plant from the Plants tab with + Add Mother. Pick a strain from the catalog, or just type one in.
- Set up a few tasks so watering, feeding, and pruning reminders don't slip.
- Export a backup once you have some entries in. It's a plain JSON file from the gear menu that you keep.
Header Toolbar
The fixed header at the top of the app contains quick-access buttons:
- Offline indicator, a small amber Offline pill appears at the left of the header cluster whenever your device loses network connectivity. Tooltip reminds you that your edits are still saved locally and will sync when you reconnect; brief toasts confirm the transition in both directions. Hidden when online.
- 🌤 Weather, set your location to auto-fill temperature and humidity when logging environment readings.
- 🌙 Moon Phase, view the current lunar phase, illumination percentage, KNF planting guidance, and upcoming phases.
- ☁ Cloud Sync, back up your data to Firebase. Syncs across devices and prevents data loss if the browser is cleared.
- 💾 Backup Nudge, a passive indicator that appears here only when your last export is getting stale. Border turns amber after 14 days, red after 30 days. Click to export immediately. Hides itself when backups are fresh or when you have no data yet.
- ☾ Theme Toggle, cycles between three modes: Dark → Light → Auto. Auto follows your operating system’s prefers-color-scheme setting and switches in real time when your OS theme flips (sunset/sunrise schedules, manual toggles, etc.). A small A badge appears on the toggle whenever Auto mode is active so you can tell at a glance.
- ⚙ Gear Menu, opens the settings dropdown with additional tools.
The version number in the footer (e.g. v2.23.0) is a clickable button. Tap it to open the About dialog with the current version, an “installed PWA” marker if you’re running the installed app, links to the GitHub repo, the GPL-3.0 license, and quick-action buttons for What’s New, Full Changelog (renders CHANGELOG.txt in a styled in-app modal), and this Help Guide. The About dialog also re-states the app’s posture: no telemetry, no third-party trackers, and optional integrations off by default.
Below the header, the tab nav is organized into five sections: Dashboard (single tab) plus four dropdown groups: Plants (Plants / Clones / Strains), Care (Tasks / Feeding / IPM), Records (Journal / Harvest / Calendar), and Insights (Environs / Readings / Analytics). Click a group to reveal its sub-tabs. The parent group highlights cyan whenever any of its children is the active tab, so you always know where you are.
Tab BadgesThree of the tab-group buttons can show a small numeric pill badge when there’s something needing attention, visible at a glance from any tab, no need to open each one to check:
- Care, total of overdue + due-today tasks (red; turns amber if more than 5)
- Plants, count of unresolved IPM issues across your fleet
- Insights, environment alerts where current readings drift past your configured thresholds
Badges hide entirely when the count is zero. Counts above 99 collapse to 99+ to avoid layout shift.
Sticky ToolbarThe filter / Add bar that sits at the top of long tabs (Plants, Journal, Harvest, Strains, Feeding, etc.) is now sticky, it stays pinned just below the tab nav while you scroll the panel. Re-filtering or hitting + Add never requires scrolling back to the top. Reverts to a normal flow position in print/PDF export so reports look clean.
Gear Menu OptionsThe gear menu opens a settings dropdown organized into six collapsible groups, so the 50+ items aren’t a wall of links. The expanders below mirror the in-app structure, click any group to see what’s inside.
Top-level entries (always visible at the top and bottom of the menu):
- 🔍 Search Commands, opens the Command Palette for fuzzy-searching all 80+ commands. Also reachable via Ctrl+K or /. See the Keyboard Shortcuts section.
- ❓ Help Guide, opens this help documentation in a new tab.
⚡Quick Actions8 items
- 🔔 Notifications, enable browser notifications for overdue tasks and environment alerts.
- 🏔 Toggle Banner, show or hide the hero banner image on the Dashboard.
- ⇩ Export Data, download all your data as a JSON backup file.
- ⇧ Import Data, restore from a previously exported JSON file. Shows a diff preview before applying.
- 🔒 Export Encryption, toggle password-protected exports on or off (AES-256-GCM, PBKDF2 with 600,000 iterations). When enabled, Export Data prompts for a password and the file saves as
.encrypted.json. - 🧹 Clear Demo Data, removes records the demo fixture created (tagged with
_demo:true) while preserving everything you’ve added yourself. Shows a per-category confirm modal before deleting. - 📲 Install App, on Android/Chrome, fires the native install prompt so you can add Plant Manager to your home screen. On iOS Safari (where the browser doesn’t expose a prompt) it opens a walkthrough showing the Share → Add to Home Screen → Add flow.
- 🧚 Run Setup Wizard, re-opens the first-run Setup Wizard at any time, even after you’ve added plants or skipped it. Clears the dismissed flag and navigates back to the Dashboard with the wizard ready.
🏷Tags & Labels5 items
- 🏷 Print Plant Tags, generate printable QR code tags for all plants with generation badges (S1/F1/F2/F3+), parent lineage, and offspring counts.
- ✂ Clone Tags, generate QR code tags for clone batches with mother reference, cutting counts, and success rate.
- 🧬 Breeding Cross Tags, QR labels for breeding crosses showing ♀ Mother × ♂ Father = Offspring.
- 🌱 Seed Bank Labels, QR labels for seed packets with strain, seed count, germination rate, and age.
- 🔍 QR Lookup, paste-to-decode scanner for all QR tag formats with database lookup.
🌱Growing18 items
- 📋 Feed Schedules, apply built-in or custom nutrient schedule templates (GH Flora, Fox Farm, Gaia Green, Down To Earth, KNF, plus your own) to auto-create feeding tasks.
- 💰 Cost Tracker, log and track grow expenses across 7 categories with cost-per-gram analytics.
- 🔄 Grow Cycles, apply phased grow cycle templates that auto-create tasks from seed to harvest.
- 📦 Grow Runs, group plants into named grow runs with aggregate stats and side-by-side run comparison.
- 🧬 Breeding Tracker, log pollen collection, crosses, and seed harvests across your breeding program.
- 🌱 Pheno Hunt, phenotype-selection workflow for working through a packet of seeds and picking keepers.
- ⚗ Calibration Log, per-meter pH/EC calibration tracking with overdue reminders and per-device history.
- 🌸 Harvest Forecast, predicts harvest windows for flowering plants from strain flowering time and start date.
- 🔄 Spray Rotation, manage IPM treatment rotation by mode of action to prevent resistance.
- 💧 Water Quality Log, track source water TDS/ppm, chloramine, and other water-chemistry data.
- 🧬 Genetic Tree, visualize the full lineage of any plant from parent mothers through clone generations.
- ✅ Pre-Grow Checklist, setup checklist for prepping a new grow cycle (equipment, supplies, environment).
- 🌱 Garden Stats, lifetime totals across every grow: total harvests, total yield, total expenses, average quality.
- 🍃 Terpene Profiles, log terpene and cannabinoid profiles per strain (myrcene, limonene, etc.).
- 📈 Crop Steering, substrate dryback and irrigation logs for steering plants generative vs vegetative.
- 🌡 Env Recipes, named environmental setpoint profiles per growth stage (seedling, veg, early flower, late flower).
- 🧪 Ferment Tracker, track KNF and lacto fermentations (FPJ, FAA, LABS, IMO) from start through harvest.
- 📋 Batch Feed, log a single feeding across multiple plants at once instead of one-by-one.
🧮Calculators11 items
- 🧪 KNF Calculator, dilution calculator for Korean Natural Farming inputs (FPJ, FFJ, FAA, OHN, LABS, IMO, WCA, BRV, Sea Water).
- 🌡 VPD Calculator, calculate vapor pressure deficit with auto-fill from environment readings; color-coded zones per growth stage.
- ☀ DLI Calculator, estimate Daily Light Integral from light type, wattage, and photoperiod.
- 🌱 Soil Mix Calc, calculate soil mix recipes with adjustable volume (gal/L/cu ft) and components including biochar (Coots, BuildASoil, Tropical Living, custom).
- 📏 Medium Fill Calc, how much growing medium fills a bed, pot, or tent footprint, in cubic feet, gallons, or liters, plus bag counts.
- 🧪 Nutrient Mix Calc, mix-by-volume calculator for any feeding recipe; recall saved recipes.
- 💡 Light Map, PPFD grid mapping for visualizing canopy light distribution.
- 📐 Unit Converter, convert grams/ounces, ml/oz, gallons/liters, °F/°C, ft/m, and more.
- ⚡ Power Cost Calc, estimate kWh and dollar cost per grow from wattage and photoperiod.
- 📈 Strain Compare, side-by-side comparison of strains from your library on flowering time, yield, effects, terps.
- 🍃 CO&sub2; Calculator, CO&sub2; supplementation amount calculator for sealed environments.
🔬Diagnostics5 items
- 🔎 Pest Identifier, open the Pest ID tool to identify pests from a photo via Google Cloud Vision or manual Google Lens.
- 🤖 Pest ID Settings, configure your Google Cloud Vision API key for auto-identification.
- 🩹 Deficiency Wizard, 3-step diagnostic tree to identify nutrient deficiencies and log them as IPM issues.
- 🌿 Companion Planting, reference guide for beneficial and antagonistic companion plants.
- 🧪 pH Nutrient Chart, visual nutrient availability chart by pH (the “Mulder’s chart” reference).
📊Reports & Layout4 items
- 📄 Export Report, generate printable Plant Reports, Garden Reports, or full Analytics Reports (print-to-PDF).
- 📐 Room Layout, visual grid diagram of plant positions per environment with per-cell pot size and growing medium.
- 📖 Grow Journal Export, export the full Journal as a styled HTML diary suitable for sharing or printing.
- 📷 Photo Compare, side-by-side photo timeline view to see progress between two captured dates.
Several feature-dense panels include a small circular ? icon next to their title (KNF Calculator, VPD Calculator, DLI Calculator, Deficiency Wizard, Pheno Hunt, Crop Steering, etc.). Click any of them to jump directly to the relevant anchor in this help guide. Each icon opens in a new tab so you don’t lose your place in the app. Hover for a tooltip describing what topic the icon links to.
Dashboard Overview
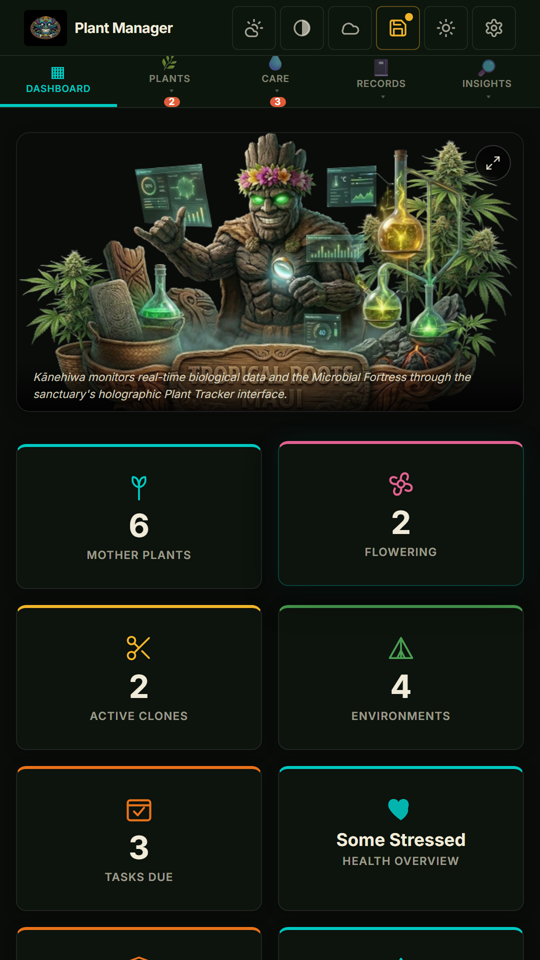
The Dashboard is your home screen. It's where you see the whole garden at once.
Stat CardsThe top row shows live stat cards: Mother Plants, Flowering Count, Active Clones, Environments, Tasks Due, Health Overview, Active IPM Issues, Environment Alerts, Strains, Total Yield, plus Weather and Moon Phase widgets.
Action-Required LayoutThe dashboard prioritizes what needs your attention. When alerts exist (overdue tasks, environment alerts, feeding alerts, IPM reapplications, low seed stock), they appear under an ⚠ Action Required heading directly below the stats grid, above the inline cards and Quick Actions, so you see what needs doing before you scroll through chrome. When no alerts exist, this section is hidden entirely.
Demo Data BannerIf you loaded the demo fixture (via the Setup Wizard, the Command Palette, or a ?demo URL), a banner appears between the hero and stats grid with three actions: Clear demo data (surgical removal of tagged records), + Add my plant (start tracking real grows alongside the demo), or Keep mixed (hide the banner; reversible via Command Palette → Show Demo Banner). See the Getting Started section for the full demo lifecycle.
A tip banner at the bottom of the dashboard cycles through 50+ helpful tips. Use the arrow buttons to navigate manually, or let them auto-rotate every 30 seconds. Click the × button on the right to permanently hide the banner, a small 💡 Show tips pill appears in its place that you can click anytime to bring it back. Dismissal state persists in localStorage.
Quick Actions30 quick action buttons let you jump directly to any feature without switching tabs: Add Mother, Add Environ, Log Clones, Add Task, Log Reading, Log Feeding, Add Photo, Log Issue, Add Strain, Log Harvest, KNF Calculator, Seed Bank, Quick Water, Daily Snapshot, Feed Schedule, Costs, Grow Cycles, Compare Plants, Soil Mix Calc, Medium Fill Calc, Export Report, Pest ID, Pest Guide, VPD Calc, DLI Calc, Deficiency Wizard, Grow Runs, Breeding, Calibration, and Room Layout.
Overdue Tasks & Environment AlertsIf any tasks are overdue, they appear at the top of the dashboard with a red warning indicator. You can check them off right from the dashboard. Environment alerts display when any reading exceeds the thresholds you set (temp, humidity, pH).
Activity FeedThe bottom of the dashboard shows your 15 most recent actions (adding plants, logging feedings, completing tasks, etc.) with relative timestamps.
Mother Plants
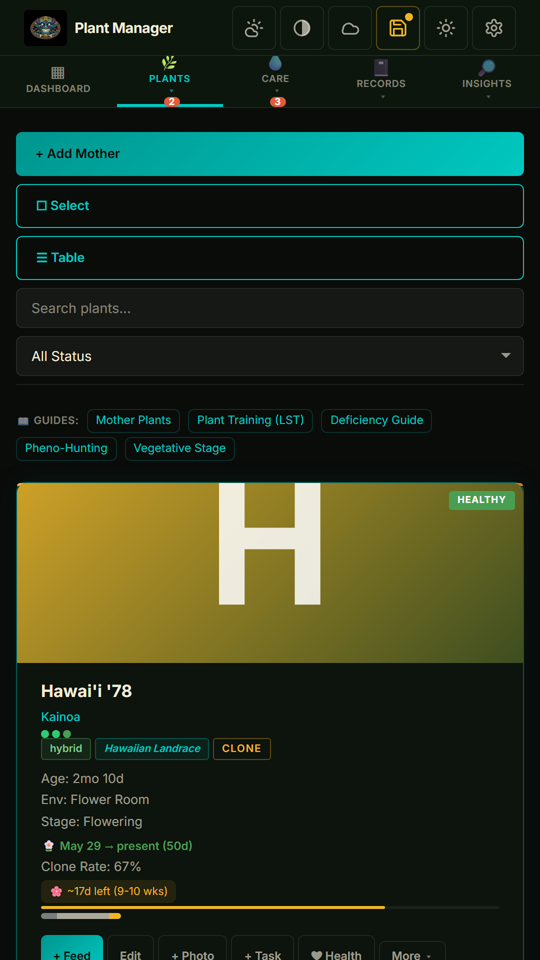
The Plants tab is where you manage your mother plants. Each plant has a card showing its photo, health status badge, strain name, type, breeder, age, environment, growth stage, flowering dates, and clone success rate.
Adding a PlantTap + Add Mother and fill in the form. You can pick a strain from your Strain Library (which auto-fills strain, type, and breeder) or enter details manually. Fields include: strain name, strain type (indica/sativa/hybrid), breeder, genetics, source (seed/clone/tissue culture), date acquired, environment, growth stage, health status, photo, and notes.
Health StatusEach plant has a health status: Thriving, Healthy, Stressed, Sick, or Quarantine. This status appears as a colored badge on the card and is used for filtering.
Stage-Themed Card StripesEach plant card has a colored accent stripe across the top, color-coded by growth stage: lime/green for seedling and vegetative, gold/orange for flowering, violet for mature, muted gray for declining. Cards lift 3px and gain a subtle cyan glow on hover; the stripe brightens to full opacity. Scan a grid of plants and you can see how the lifecycle is spread across them.
Plant Card ActionsEach card has action buttons along the bottom:
- Edit, modify any field. If you change the health status, a health check is auto-logged.
- + Clone, log a clone batch from this mother.
- + Task, create a task linked to this plant.
- + Feed, log a feeding entry.
- + Photo, add a journal photo.
- + IPM, log a pest or disease issue.
- 🔎 Identify, open the Pest Identification tool to snap a photo and identify pests or diseases.
- + Harvest, record a harvest.
- ❤ Health, log a 1–5 health score (see Health Check below).
- 🏷 Tag, generate a printable QR code tag for this plant.
- 📅 Timeline, view the full chronological event history combining feedings, photos, IPM, harvests, health checks, dry-backs, clones, and task completions.
- ⚖ Dry-Back, log dry-back weight readings and view a line chart of weight over time.
- 🌳 Lineage, view the full clone family tree visualization.
- 📄 Report, generate a printable Plant Report with full grow history, stats, feedings, harvests, IPM log, and health checks.
- 📈 Compare, select this plant for side-by-side comparison with 1–2 other plants.
- 🔬 Trichome, log trichome readings (clear/cloudy/amber percentages) with harvest-window recommendations.
- ✂ Training, log training events (topping, LST, SCROG, etc.) with technique badges and notes.
- 🧬 Breed, log pollen collection, crosses, or seed harvests for this plant.
- Archive, retire the plant from the active roster. You’re asked why (Harvested, Retired, Died, or Culled); Died and Culled feed the “money lost” figure in Strain Comparison. A toast lets you undo for a few seconds.
Use the search bar to find plants by strain name, breeder, environment, or notes. The dropdown filter narrows results by health status.
Health Check DotsColored dots appear below each plant's name for recent health scores: green (4–5), gold (3), orange (2), and red (1).
Batch Operations (Select Mode)Tap Select to enter batch mode. Check multiple plants, then use the batch bar to:
- Update Health, set the same health status on all selected plants.
- Update Stage, change growth stage for all selected.
- Move Environ, reassign all selected to a different environment.
- Print Tags, generate QR tags for all selected plants.
- Archive Selected, archive multiple plants at once.
Grow Environments
Environments represent your physical grow spaces, tents, rooms, greenhouses, or outdoor areas.
Environment Fields- Name, a descriptive name like "Veg Tent 4x4" or "Flower Room".
- Type, Tent, Room, Greenhouse, Outdoor, Closet, or Other.
- Dimensions, e.g., 4x4x6.5.
- Light Type & Schedule, e.g., LED 600W, 18/6.
- Alert Thresholds, set min/max for temperature, humidity, and pH. When readings exceed these limits, the Dashboard will show environment alerts.
Each card shows the environment type badge, name, dimensions, light info, plant count, and the latest reading values (temp, humidity, pH). Values that exceed your thresholds appear in red. A pH/EC calibration badge shows days since last calibration (with a warning color if overdue).
Environment Card ActionsEach environment card has: Edit, + Log Reading, 🌡 VPD (open VPD Calculator pre-filled with this environment’s latest reading), 📐 Layout (open the Room Diagram for this environment), and Archive.
Clone Tracking
The Clones tab tracks clone batches taken from your mother plants. Each batch records how many cuttings were taken, how many rooted successfully, and how many failed.
Clone Batch Fields- Mother Plant, the source mother.
- Date Taken, when cuttings were made.
- Total Taken / Rooted / Failed, numeric counts.
- Rooting Status, Rooting, Rooted, Transplanted, or Failed.
- Medium, Rockwool, Rapid Rooter, Soil, Perlite, Aero, or Water.
- Notes, free-text observations.
The top of the tab shows aggregate stats: total taken, total rooted, total failed, total batches, and overall success rate. Each batch card shows a color-coded progress bar (green = rooted, red = failed, gray = pending).
Clone success rates automatically appear on the corresponding mother plant cards on the Plants tab.
Clone QR TagsTap the 🏷 Tag button on any clone card to generate a printable QR label. Clone tags include the mother plant reference, strain with generation label, cutting date, rooted/failed/total counts, success rate, and rooting status. Print all clone tags at once from the gear menu via Clone Tags. The QR payload uses the TRM-C format and can be decoded with the QR Lookup tool.
Task Scheduler
Create tasks to remind yourself of watering, feeding, pruning, IPM treatments, repotting, or cleaning. Tasks can be linked to a specific plant or set as global (all plants).
Task TypesWatering, Feeding, Pruning, IPM, Repotting, Cleaning, and Other. Each type has a unique icon for easy scanning.
One-Time vs RecurringOne-time tasks disappear after completion. Recurring tasks automatically re-schedule at your chosen interval (e.g., every 3 days). Completing a recurring task advances the due date to the next interval.
Task SectionsTasks are organized into sections: Overdue (red), Due Today (gold), Upcoming (default), and Recently Completed (faded). Tap the circular checkbox to complete a task.
FiltersFilter by plant or by task type to focus on what matters.
Feeding Log
Log every feeding and watering event with detailed nutrient tracking.
Feeding Entry Fields- Plant & Environment, link the feeding to a plant and environment.
- Products, add one or more nutrient products with amounts and units. The built-in catalog includes 75+ products from major brands: General Hydroponics, Fox Farm, Advanced Nutrients, Botanicare, Canna, Down To Earth, Athena, Gaia Green, Neptune's Harvest, and KNF inputs.
- Volume & Unit, total solution volume in gallons or liters.
- pH In / pH Out, track pH drift. The card highlights drift greater than 0.5.
- EC/PPM, electrical conductivity measurement.
- Water Source, Tap, Filtered, Rain, RO, or Well.
- Notes, any observations.
The Quick Water button (on the Feeding toolbar and Dashboard) opens a streamlined form for plain water events. It captures plant, environment, volume, pH in/out, water source, and notes, skipping the full nutrient product selector.
Custom ProductsIf a nutrient isn't in the catalog, tap + Add Custom Product to save your own. Custom products persist in your data and appear in the product picker going forward.
Photo Journal
Build a visual timeline of each plant's growth. Upload photos with growth stage tags and notes. Photos are stored locally as compressed base64 images (auto-resized to 400px max dimension).
Adding a PhotoTap + Add Photo, select a plant, upload an image (three ways, see below), choose the growth stage (Seedling, Vegetative, Flowering, Harvest, Curing), and add optional notes.
Three ways to attach an image- Click to pick, the original flow. Tap the preview tile to open the file picker.
- Drag & drop, on desktop, drag any image file onto the preview tile. A cyan dashed outline confirms the drop target while you drag.
- Paste from clipboard, press Ctrl+V (or Cmd+V) anywhere in the modal to paste a screenshot or copied image. Especially handy for screenshots taken with Win+Shift+S or Cmd+Shift+4.
You can also send a photo into the Journal from outside the app on Android: see Receive shared photos in the Install section.
EXIF Date DetectionWhen you upload a photo, Plant Manager reads the photo's EXIF DateTimeOriginal from the original file before resizing. If a capture date is found, the journal entry's timestamp uses that date instead of the upload date, so a photo you took last Tuesday lands on Tuesday in the timeline, not today. A small ✓ Using photo capture date: ... chip confirms detection during upload. The resized version stored in the app contains no EXIF data (canvas resize strips metadata).
EXIF Orientation Auto-CorrectionMany phone cameras (especially Android) save portrait photos with landscape pixel data and an EXIF Orientation tag instructing viewers to rotate. Plain canvas.drawImage() ignores that tag, which used to leave portrait shots showing up sideways in the journal. Plant Manager now reads the Orientation tag (values 1–8) and applies the appropriate rotation, flip, or transpose to the canvas before re-encoding the JPEG, so portrait photos always land right-side up regardless of how the camera stored them.
Tap any photo in the grid to open a full-screen lightbox viewer. Features:
- Prev/next arrows on either side cycle through photos in the current filtered view
- Click the image to toggle 2× zoom (cursor changes from zoom-in to zoom-out)
- Swipe left/right on touch devices to navigate
- Arrow keys (←/→) on desktop
- Caption below the image shows plant name, capture date, growth stage, and notes
- Counter at the bottom shows position (e.g. “3 / 8”)
- Delete shortcut in the top-left removes the current photo (with toast-undo)
- Esc, click on backdrop, or tap the × button to close
Use the plant dropdown to filter photos to a single plant. The lightbox respects the current filter, so prev/next walks through whichever subset you’re viewing.
IPM Log
The IPM (Integrated Pest Management) tab tracks pest sightings, disease outbreaks, and treatment applications.
Issue Fields- Pest/Disease, choose from 11 common types: aphids, spider mites, fungus gnats, whiteflies, thrips, powdery mildew, bud rot, root rot, nutrient burn, nutrient deficiency, or other.
- Severity, Low, Medium, High, or Critical.
- Plant & Environment, link to the affected plant and/or environment.
- Treatment Applied, pick from a catalog of 60+ IPM products organized by category: insecticides, miticides, fungicides, biologicals, organic remedies, KNF treatments, and environmental controls.
- Photo & Notes, document what you observe.
The IPM form includes a built-in Pest Identification section with 4 buttons: Snap Photo (camera/upload), Auto-ID (Google Cloud Vision AI, requires API key), Lens (opens Google Lens for manual lookup), and Guide (opens the Visual Pest Guide). When Auto-ID identifies a pest, tap Apply to auto-fill the pest dropdown, issue type, and severity without leaving the form.
Active vs ResolvedIssues start as Active and can be marked Resolved when the problem is handled. Use the status filter to view only active or resolved issues.
Dashboard IntegrationActive IPM issues show as a count on the Dashboard stat cards. The number helps you keep an eye on unresolved pest pressure.
Harvest Log
Record harvest data for each plant including weights, cure tracking, and quality ratings.
Harvest Fields- Plant & Environment, which plant and where it grew.
- Harvest Date and Flowering Start/End, calculates total flowering days.
- Wet Weight & Dry Weight (g), auto-calculates dry ratio percentage.
- Trim Type, Wet, Dry, or Both.
- Cure Method, Jar, Bag, Grove Bag, Bucket, Hang Dry, or Other.
- Cure Status, Fresh, Drying, Curing, or Complete.
- Quality Rating, 1–5 stars.
- Terpene Notes, Flavor Notes, Storage Location, detailed record keeping.
- Photo & Notes, document the final product.
Total yield appears on the Dashboard in grams or ounces (auto-converts at 28.35g/oz). Harvest data feeds into the Analytics tab's yield charts.
Strain Library
The Strains tab is your personal strain library plus a built-in catalog of 360+ strains from Maui-based breeders.
Your StrainsManually add strains or import them from the catalog. Each strain card shows name, type (indica/sativa/hybrid), breeder, genetics, flowering time, and average review rating if you have reviews.
Browse CatalogThe built-in catalog includes strains from 7 breeders: Sticky Finger Seeds, Hawaiian Budline, Ziplock Seeds, Makena Genetics, Deep Green Genetics, Aloha Island Genetics, and CloneFreak (clones only). Filter by breeder, search by name, and quick-add strains to your library.
Seed BankAccess the Seed Bank from the Strains toolbar or the Dashboard. Track seed packets with strain name, breeder, count, type (feminized/regular/autoflower), source, purchase date, germination rate, and notes. The Browse Catalog button inside the Seed Bank lets you quick-add seed entries from the strain catalog (excludes clone-only providers). Features include: low stock warnings (⚠), seed age tracking with viability alerts, germination stats summary, “Plant Next” suggestion scoring, sort controls, and a Print Labels button to generate QR seed packet labels.
Strain ReviewsTap the ⭐ Reviews button on any strain card to write a personal grow review. Reviews capture:
- Overall rating (1–5 stars)
- Grow difficulty, yield rating, and actual flowering time
- Grow method, effects, terpene/flavor notes
- Grow tips and general notes
- Optional photo
Average ratings display directly on strain cards so you can compare strains quickly.
Analytics Charts
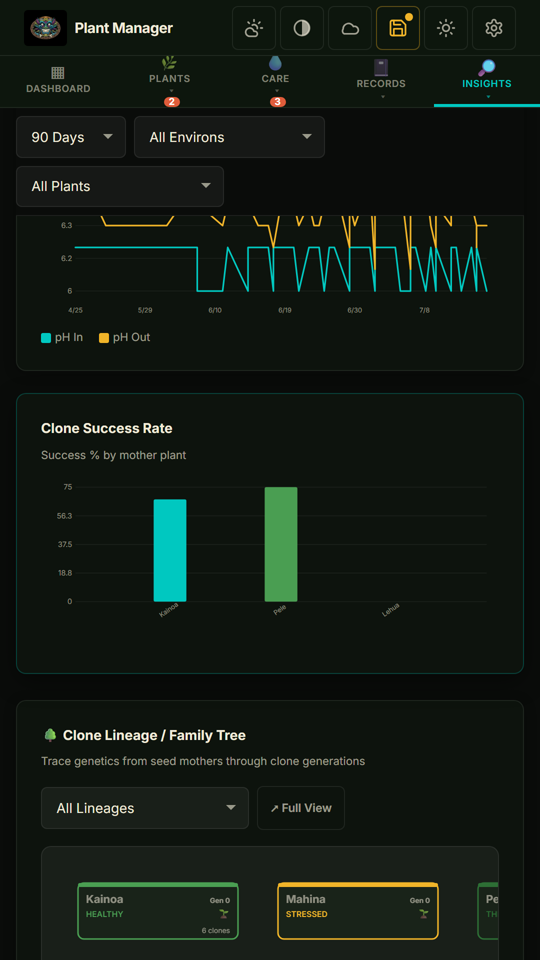
The Analytics tab renders 33 interactive SVG charts from your data. All charts are pure SVG, no external libraries required. Charts gracefully hide when insufficient data exists.
FiltersUse the date range (7 days, 30 days, 90 days, All Time), environment, and plant dropdowns to narrow chart data.
Core Charts- Environment Trends, line chart of temperature, humidity, pH, and EC/PPM over time.
- Feeding pH Drift, line chart comparing pH In vs pH Out across feedings.
- Feeding EC/PPM Drift, line chart comparing EC In vs EC Out with nutrient uptake trends.
- Feeding Frequency, feedings per week bar chart color-coded by pH drift severity.
- Clone Success Rates, bar chart comparing rooted vs failed counts per mother.
- Family Tree, visual lineage tree showing mother-clone relationships.
- Health Distribution, donut chart of plant health statuses.
- IPM Overview, bar chart of pest/disease types by severity.
- IPM Treatment Efficacy, success rate and resolution time by treatment type.
- Activity Heatmap, calendar heatmap showing daily activity levels.
- Harvest Yield Timeline, line chart of individual and cumulative dry weight over time.
- Yield by Strain, bar chart ranking total yield per strain (top 12).
- Quality Distribution, donut chart of harvest star ratings with average score.
- Flowering Days vs Yield, bar chart correlating flowering duration with dry weight.
- VPD Trends, line chart tracking vapor pressure deficit over time with zone bands for each growth stage.
- Harvest Estimate Accuracy, compare actual flowering days to strain catalog estimates per strain.
- Strain Performance, rank strains by yield, quality, flower days, and best environment.
- Environment ↔ Outcome Correlations, cross-reference temp/humidity during flowering with harvest results.
- Cost Breakdown, donut chart showing expense distribution across 7 categories with dollar totals and cost per gram.
- Cost per Gram by Strain, bar chart showing $/gram allocated by strain (direct + proportional shared expenses).
- Cost Efficiency Over Time, monthly $/gram (orange) and cumulative $/gram (cyan) trend lines with average reference line.
- Monthly Expense Trend, multi-line chart showing spending by category over time.
- Strain ROI Ranking, composite score (0–100) combining yield (30%), quality (30%), cost efficiency (25%), and consistency (15%) with ranked table.
- Training → Yield, bar chart comparing average dry weight by training technique (topping, LST, SCROG, etc.).
- Trichome Maturity Timeline, clear/cloudy/amber percentage progression over time with harvest window zone.
- Grow Run Comparison, yield, quality, duration, and cost-per-gram for completed grow runs.
- Task Completion Rate, color-coded bars showing which tasks get done vs skipped.
- Health Trend, average health score (1–5) over time with “Good” zone overlay.
- Seed Germination vs Age, scatter plot showing seed viability decline over months of storage.
- DryBack Curves, overlay dry-back percentage curves for multiple plants with optimal zone.
- Breeding Success, pollen/cross/seed harvest summary with cross detail table.
- Feeding → Yield, average EC during flowering vs dry weight to find the nutrient sweet spot.
- Calibration Monitor, meter status table with overdue/due-soon/OK indicators.
Grow Calendar
A month-view calendar that overlays all your events: tasks, feedings, journal photos, harvests, IPM entries, and harvest estimate windows. Each day cell shows colored dots for event types and the moon phase icon.
NavigationUse the left/right arrows to navigate months, or tap Today to jump back to the current month.
Day DetailTap any day to see a full list of events for that date, plus the moon phase name and KNF planting guidance for that day.
Color Legend- Cyan dot, Tasks
- Green dot, Feedings
- Gold dot, Journal entries
- Orange dot, Harvests
- Red dot, IPM issues
Environment Readings
The Readings tab shows logged environment data and lets you record new readings.
Reading Fields- Environment, select which grow space.
- Temperature (°F), Humidity (%), pH, EC/PPM, core environment metrics.
- Notes, any observations.
If you set up Weather via the header button, outdoor temp and humidity can auto-populate when logging readings.
Latest ReadingsThe tab shows the latest reading values at the top, plus a historical table with sparkline trend indicators.
Additional Tools
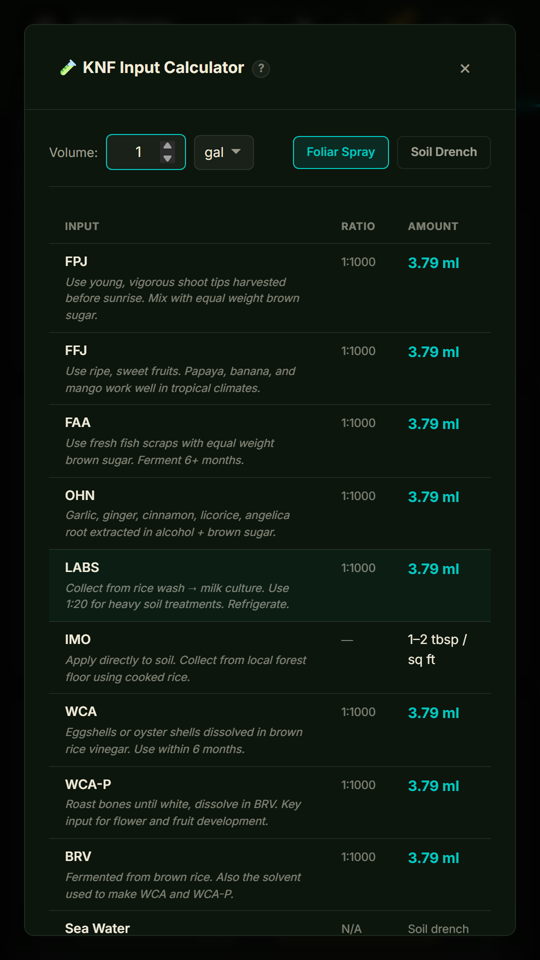
Open from the Dashboard or gear menu. Enter your water volume, select a KNF input (FPJ, FFJ, FAA, OHN, LABS, IMO, WCA, WCA-P, BRV, or Molasses), and toggle between Foliar Spray (1:1000) and Soil Drench (1:500) dilution rates. The calculator shows the exact amount needed.
Moon Phase TrackerThe moon widget on the Dashboard shows the current phase, illumination, and time until the next phase. Tap it for a detailed modal with KNF planting guidance for each of the 8 lunar phases, upcoming phase dates, and a visual cycle overview.
QR Code Plant TagsGenerate printable QR code labels for any plant. Each tag includes a QR code with v2 payload (encoding strain, generation, parent lineage, and breeder), a color-coded generation badge using cannabis convention (S1 = seed origin, F1, F2, F3+), parent lineage line, offspring count, strain, breeder, type, stage, environment, and health status. Print single tags from a plant card or batch-print all tags from the gear menu. Batch printing includes generation filter buttons (All, S1, F1, F2, F3+) with a live plant count.
Breeding Cross TagsGenerate QR labels for breeding crosses and seed harvests. Each tag shows ♀ Mother × ♂ Father = Offspring strain name, seed count, date, and a QR code with TRM-X payload. Accessible from the Breeding Tracker modal footer or the gear menu.
Seed Bank LabelsGenerate QR labels for seed packets. Each label shows strain, breeder, seed count, fem/reg badge, germination rate bar, purchase date with age, and low-stock warning. The QR payload uses TRM-S format. Accessible from the Seed Bank modal header or the gear menu.
QR Lookup / DecoderOpen from the gear menu. Paste any scanned QR text to decode it. The tool parses 5 formats: TRM2 (plant tags), TRM-C (clone tags), TRM-X (breeding crosses), TRM-S (seed labels), and TRM (legacy v1 tags). Decoded entries show full details with action buttons to open the plant, view lineage, or print a tag. Graceful fallback for deleted or unknown entries.
Daily SnapshotOpen from the Dashboard to generate a full daily report. The snapshot includes the date, current weather, moon phase with KNF guidance, pending tasks, active IPM issues, environment alerts, and recent feedings. Three actions:
- Copy to Clipboard, for pasting elsewhere
- Share…, on browsers that support
navigator.share(mobile + Chromium desktops), opens the OS share sheet so you can send the snapshot text straight to Signal, email, Drive, etc. The button is hidden on browsers without share support - Save as Journal, persists the snapshot as a journal note
Toggle Auto Daily Snapshot to automatically save a snapshot to the journal on first app open each day.
Health Check / Score TrackerTap ❤ Health on any plant card to log a quick 1–5 score with optional notes. Scores are: 1 = Critical, 2 = Poor, 3 = Fair, 4 = Good, 5 = Excellent. Recent scores appear as colored dots on plant cards, and health changes during plant edits are automatically logged.
Lineage TreeTap 🌳 Lineage on a plant card to view a visual family tree showing the mother plant and all clone batches branching from it. The tree is rendered as an interactive SVG on the Analytics tab.
Plant TimelineTap 📅 Timeline on any plant card to view a chronological event history combining 8 data sources: feedings, photos, IPM logs, harvests, health checks, dry-back readings, clone batches, and task completions. Events are sorted by date with color-coded dots for each type.
Feed Schedule TemplatesOpen from the Dashboard or gear menu. Choose from 5 built-in nutrient schedules: GH Flora Series (10 weeks), Fox Farm Trio (8 weeks), Gaia Green Organic (5 weeks), Down To Earth Organic (9 weeks, dry-amendment top-dress), or KNF Inputs (8 weeks). You can also create, edit, and delete your own Custom Feed Schedules with custom week names, product lists, and amounts. Preview the weekly schedule, then apply it to a plant to auto-create one-time feeding tasks for each week. Note: the organic schedules finish on plain water rather than a salt flush, a pre-harvest flush only applies to mineral/salt nutrient lines.
Dry-Back TrackingTap ⚖ Dry-Back on a plant card to log weight readings over time. Enter the weight, unit (g/oz/lb), and optional notes. Configure saturated and dry weights per plant to calculate dry-back percentage. The chart shows readings with reference lines and an optimal zone overlay (10–20% dry-back). A “Time to Water” estimate appears when below the optimal zone. Multi-plant dry-back curve comparison is available on the Analytics tab.
Harvest EstimateIf a plant's strain has a flowering time set and the plant has a flowering start date, a harvest estimate badge appears on the plant card. It shows a progress bar, estimated harvest window, and days remaining. Harvest estimate events also appear on the Calendar.
Cost TrackerOpen from the Dashboard or gear menu. Log grow expenses across 7 categories: Seeds, Nutrients, Equipment, Soil & Media, Electricity, Water, and Other. Optionally assign expenses to a specific plant for direct cost attribution. The summary shows total spent, cost per gram, and spending breakdown. Five cost analytics charts appear on the Analytics tab: Cost Breakdown (donut), Cost per Gram by Strain (bar), Cost Efficiency Over Time (monthly & cumulative $/gram trend), Monthly Expense Trend (by category), and Strain ROI Ranking (composite score).
Grow Cycle TemplatesOpen from the Dashboard, gear menu, or plant cards. Choose from 4 built-in grow cycle templates: Indoor Photoperiod (16 weeks / 9 phases), Indoor Autoflower (12 weeks / 7 phases), Outdoor Tropical Maui (21 weeks / 6 phases), or Clone to Flower (12 weeks / 7 phases). Each phase includes week range, phase name, light schedule, and a list of tasks. Preview all phases in a table, then apply to a plant, this auto-creates one-time tasks with calculated due dates from seedling through harvest.
Soil Mix CalculatorOpen from the Dashboard or gear menu. Choose from 4 pre-built soil recipes: Coots Mix (classic 1:1:1 living soil), BuildASoil 3.0, Simple Coco Mix, or Tropical Living Soil (Maui-style, a coco-and-compost living soil with biochar for CEC, no imported peat). You can also start a Custom Mix from scratch. The calculator has 15 components across 3 categories: Base Mix (Peat Moss, Coco Coir, Compost, Biochar) and Aeration (Perlite, Pumice, Rice Hulls) are entered as parts by volume, while Amendments (Worm Castings, Bone Meal, Blood Meal, Kelp Meal, Gypsum, Dolomite Lime, Rock Phosphate, Azomite) are cups per gallon of soil. Set the total volume in gallons, liters, or cubic feet (handy for bagged soil), edit any ratio or amount, and quantities update live in the unit you chose. Save custom recipes for later use.
Medium Fill CalculatorOpen from the Dashboard, gear menu, or Command Palette. Works out how much growing medium fills a container or bed. Pick a shape: Rectangular (bed / tent footprint) or Round (pot), and enter the dimensions in feet, inches, or cm, plus optional quantity and fill-level percentage. Results show the total volume in cubic feet, gallons, and liters, plus how many bags you’d need at 1.0 / 1.5 / 2.0 / 3.0 cu ft each. A Build this mix in the Soil Mix Calculator button hands the volume straight over, so you can turn “how much” into “what goes in it”.
Plant ComparisonOpen from the Dashboard or a plant card's 📈 Compare button. Select 2–3 plants with checkboxes, then tap Compare. A comparison table shows 11 metrics side-by-side: strain, type, age, stage, health, environment, feedings, IPM issues, clone rate, total yield, and average health score. Best values are highlighted in cyan. Mini bar charts below the table compare feedings, yield, and health scores visually.
Export Report (Print-to-PDF)Open from the Dashboard, gear menu, or a plant card's 📄 Report button. Choose between three report modes:
- Plant Report, full grow history for a single plant including strain info, stat grid (8 metrics), feeding history (last 20), harvests, IPM log, health checks, and expense table.
- Garden Report, overall summary of your entire garden including plant count, environments, flowering count, total yield, total expenses, cost per gram, plant roster, environment list, harvest summary, and expense breakdown by category.
- Analytics Report, a full analytics export with executive summary (8 key stats), cost analysis by category with percentages, monthly spending table, strain performance table (yield, quality, $/gram per strain), environment summary with yield per space, recent harvests (last 20), and active grow runs.
Reports open in a new browser window with a dark theme on screen and clean black-and-white formatting for printing. Tap Print / Save PDF to open your browser's print dialog and save as PDF. On browsers that support navigator.share (mobile + Chromium desktops), a Share button also appears in the top-right of the report popup, it wraps the rendered HTML as a .html File and opens the OS share sheet so you can send the report straight to Signal, email, Drive, etc. The Share button auto-hides on browsers without share support.
Open from the Dashboard (🔎 Pest ID), gear menu (🔎 Pest Identifier), or a plant card's 🔎 Identify button. The tool offers three identification methods:
- Google Cloud Vision AI, snap or upload a photo and the app sends it to the Vision API for automatic analysis. It uses LABEL_DETECTION and WEB_DETECTION to match against 10 known cannabis pests and diseases, displaying the result with a confidence percentage. Tap Log as IPM Issue to pre-fill the IPM form with the identified pest, issue type, and suggested severity. Requires a Vision API key (free tier: 1,000 images/month).
- Google Lens, opens Google Lens in a new tab for manual visual identification. No API key required.
- Visual Pest Guide, a built-in reference with detailed cards for all 10 supported pests and diseases. Each card shows an emoji icon, symptom descriptions, and recommended treatments.
Open from the Dashboard (📚 Pest Guide), the Pest ID tool, or the IPM form. The guide covers 10 common cannabis issues: Aphids, Spider Mites, Fungus Gnats, Whiteflies, Thrips, Powdery Mildew, Bud Rot, Root Rot, Nutrient Burn, and Nutrient Deficiency. Each card includes visual identification signs and treatment options.
Pest ID SettingsOpen from the gear menu (🤖 Pest ID Settings) or the link in the Pest ID tool. Enter your Google Cloud Vision API key, get one free at Google Cloud Console (enable the Vision API, then create a key). Use the Test API Key button to verify your key works before saving. Without a key, Google Lens and the Visual Pest Guide remain fully functional.
VPD CalculatorOpen from the Dashboard, gear menu, or the 🌡 VPD button on environment cards. The calculator auto-fills temperature and humidity from the latest environment reading. Enter an optional leaf temperature offset (default: air temp − 2°F). The result shows your VPD in kPa with color-coded zone indicators for seedling (0.4–0.8), vegetative (0.8–1.2), early flower (1.0–1.5), and late flower (1.2–1.6). A VPD trend chart also appears on the Analytics tab.
DLI CalculatorOpen from the Dashboard or gear menu. Select your light type (LED, HPS, CMH, Fluorescent, or Sunlight), enter wattage, and set photoperiod hours. The calculator estimates PPFD from light efficiency and computes Daily Light Integral (DLI) in mol/m²/day. Optimal ranges are shown for each growth stage: seedling (12–18), veg (18–30), and flower (30–45). Selecting Sunlight clears the wattage field, since that source uses a fixed PPFD.
Shareable Tool LinksMost of the app’s tools have a 🔗 Share button in their window, every calculator (Soil Mix, Medium Fill, VPD, DLI, Nutrient Mix, KNF, CO₂, pH Chart, PPFD, Power Cost, Unit Converter); the growing tools (Strain & Plant Comparison, Harvest Forecast, Grow Cycles, Grow Runs, Pre-Grow Checklist, Garden Stats, Terpene Profiles, Crop Steering, Environmental Recipes, Water Log, Spray Rotation, Breeding Tracker, Pheno Hunt, Ferment Tracker, Seed Bank); and the diagnostic tools (Deficiency Wizard, Pest Identifier, Visual Pest Guide, Companion Planting Guide). It hands out a deep link (e.g. ?tool=soilmix) that opens straight into that tool, on mobile via the native share sheet, on desktop by copying the link to your clipboard. For VPD, DLI, Medium Fill, and KNF the link also carries your input values, so you can share an actual worked calculation: for example ?tool=vpd&t=82&rh=45 opens the VPD calc already showing that result, and ?tool=knf&vol=5&unit=gal&mode=drench opens the KNF dilutions for a 5-gallon soil drench. No account needed, and it works offline once the app is installed.
Open from the 🔬 Trichome button on plant cards. Log trichome development readings with linked sliders for clear, cloudy, and amber percentages (always totaling 100%). The tracker provides harvest-window recommendations: “Too early” when clear > 50%, “Peak THC window” when cloudy ≥ 50% and amber < 20%, and “Balanced / couch-lock” when amber ≥ 20%. A stacked bar chart shows reading history, and a compact trichome badge appears on flowering plant cards.
Training LogOpen from the ✂ Training button on plant cards. Choose from 10 techniques: Topping, FIM, LST, HST, Supercrop, Mainline, SCROG, Lollipop, Defoliation, or Other. Add optional position info, a photo, and notes. Training entries appear on the Plant Timeline and Calendar.
Nutrient Deficiency WizardOpen from the Dashboard, gear menu, or the 🩹 Deficiency Wizard button in the IPM form. The wizard walks you through 3 steps: (1) Where are symptoms? (old growth, new growth, all), (2) What do you see? (yellowing, browning, spots, curling, purple), (3) What pattern? (interveinal, edges, tips, uniform). Based on your answers, it identifies the most likely deficiency (Nitrogen, Magnesium, Iron, Potassium, Calcium, Phosphorus, Manganese, or Nutrient Burn) and provides fix instructions. A Log as IPM Issue button pre-fills the IPM form.
Grow Run ManagerOpen from the Dashboard or gear menu. Create named grow runs, assign plants, and track start/end dates. Each run shows aggregate statistics: plant count, total yield, total cost, cost per gram, and average health. Mark runs as completed when finished. Use Compare Runs to select two runs and view side-by-side stats. Completed runs appear on the Grow Run Comparison analytics chart with yield, quality, duration, and cost-per-gram metrics.
Breeding / Pollen TrackerOpen from the Dashboard, gear menu, or the 🧬 Breed button on plant cards. Log three entry types: Pollen Collection (date, storage method, viability notes), Cross (mother × father, method, notes), and Seed Harvest (parents, seed count, offspring strain name). Filter entries by plant or type. Use the Print Tags button in the Breeding Tracker footer to generate QR cross tags for all your breeding records.
pH/EC Calibration LogOpen from the gear menu (⚗ Calibration Log). Log meter calibrations with meter type (pH, EC, or both), buffer solutions used, and notes. Set a calibration interval (default: 30 days). A badge on environment cards shows days since last calibration and turns orange/red when overdue.
Fleet View / Table ModeToggle between Grid and Table view on the Plants tab using the ☰ Table / ▦ Grid button in the toolbar. Table mode shows a sortable table with 9 columns: Strain, Type, Stage, Health, Age, Environment, Last Fed, Days Since IPM, and Yield. Click any column header to sort ascending or descending. Use the filter dropdowns to narrow by stage, health status, or environment. Select multiple plants via checkboxes for bulk actions: update health, change growth stage, or move to a different environment.
Grow Room DiagramOpen from the 📐 Layout button on environment cards or the gear menu. Set grid dimensions (rows × columns) for your grow space. Click any cell to assign a plant from a picker, or click an occupied cell to unassign. Layouts save per environment.
NotificationsEnable browser notifications from the gear menu. The app will send alerts for overdue tasks and environment readings that exceed your thresholds.
Theme ToggleThe theme toggle in the header cycles between three modes: Dark (default, dark green/black), Light (cream/white), and Auto (follows your operating system’s color-scheme preference). Auto reacts in real time when your OS theme flips; a small A badge appears on the toggle button when Auto is active.
Setup WizardAn optional first-run wizard appears when the database is empty. Three options:
- Start Fresh, simplified 5-field form to add your first plant and environment.
- Import Backup, restore from a previously exported JSON file.
- 🌿 Load Demo Data, hydrates a realistic fixture (6 mother plants, 5 harvests, ~40 feedings, 4 environments, 6 strains, 5+ IPM events, full activity history) so you can explore Analytics, Lineage Tree, Strain Compare, and other features that need data to render. Existing-data users get a confirm prompt before anything is added.
The wizard is dismissible with “Skip setup”. If you skip and later want to run through it again, either to add another plant via the guided flow or to revisit the demo-data and import options, reopen it at any time from the gear menu → Run Setup Wizard or the Command Palette → “Run Setup Wizard”. The Demo Data option is also reachable on its own via the Command Palette → “Load Demo Data”, and a sharable ?demo URL parameter auto-loads it on page load (useful for previewing the app to friends).
Every record created by the demo fixture is tagged internally with a _demo:true flag at build time. This lets the app distinguish demo records from real ones, so when you’re ready to start tracking your own grow, you can remove the demo cleanly without touching anything you’ve added yourself.
When demo data is detected, a banner appears at the top of the dashboard (between the hero and stats grid) with three actions:
- Clear demo data, opens a confirmation modal listing the per-category record counts that will be removed (e.g. plants −6, harvests −5, feedings −41, ...). On confirm, only
_demo:truerecords are removed, your own data is preserved. - + Add my plant, opens the Add Mother Plant form. The demo records stay in place alongside your new plant. Useful if you want to keep the demo around as a reference while you build your own grow.
- Keep mixed, hides the banner permanently for this session (saved in localStorage as
demoBannerDismissed). The demo records stay loaded but the prompt stops nagging. You can restore the banner anytime via Command Palette → Show Demo Banner.
The Clear Demo Data action is also reachable independently of the banner via:
- The gear menu → 🧹 Clear Demo Data
- The Command Palette: Ctrl+K → "clear demo"
All three paths invoke the same confirmation flow. Users who loaded demo data before v2.22.0 (when the _demo flag didn’t exist yet) get auto-tagged on first launch under the new version by a legacy-detection backfill that recognizes records with notes:'(demo)', so the Clear command works retroactively without manual cleanup.
All strain name inputs across the app show autocomplete suggestions from the built-in catalog (400+ strains), your strain library, and existing mother plants. Matches display strain name, breeder, and a source tag (Catalog, Library, or In Use). Selecting a match auto-fills the type and breeder fields. Navigate suggestions with arrow keys and Enter; press Escape to close.
Pheno Hunt LoggerOpen from the gear menu or Dashboard. Create a pheno hunt for any strain, then add individual phenotypes and score them across 8 traits (Vigor, Structure, Aroma, Resin Production, Yield Potential, Disease Resistance, Root Development, Flower Density) on a 1–5 scale. Classify each phenotype as Keeper, Maybe, Eliminate, or Pending with color-coded cards. Supports multi-round scoring sessions to track development over time. Use the Compare feature for a side-by-side trait table with best-value highlighting, overall ranking with gold/silver/bronze badges, and an SVG radar chart overlay.
Enhanced Plant TimelineThe plant timeline (accessible via 📅 Timeline on any plant card) now shows a rich social-feed-style grow diary with date-grouped event cards. Events are organized by day with "Today" / "Yesterday" headers. Each event type has a detailed card layout: feedings show pH/EC data pills, photos display inline thumbnails, IPM entries show severity badges, harvests show weight pills, and health checks show colored score badges. Use the filter chip buttons to toggle event types on or off. A summary stats banner shows total events, timeline span, and most active event type. Supports 12 event types including breeding logs and expenses.
Cure TrackerOpen from the 🥧 Cure button on harvest cards. Log per-jar curing progress with humidity %, weight (g), burp schedule, and terpene development notes. Color-coded range indicators show ideal targets: 55–65% RH for humidity and 10–15% for weight loss. The stats banner tracks days curing, total weight loss, average humidity, and burp count. The first log entry automatically sets the harvest's cure status to "curing".
Nutrient Mix CalculatorOpen from the gear menu or Dashboard. Compute the exact amount of each nutrient product for any water volume and target EC/PPM. Select from saved products or the built-in catalog. Each product row has a unit selector: ml/gal for liquids or tbsp/gal for dry amendments (Epsom salt, cal-mag powder, top-dress), so a single recipe can mix liquid and dry inputs. The results table shows the amount needed per product with total EC. Save and load preset mixes; a warning appears when total EC exceeds the target.
Harvest ForecastOpen from the gear menu or Dashboard. Predicts harvest dates and estimated yields for all flowering plants using historical strain data plus configured flowering times. The Dashboard widget shows the next 3 upcoming harvests. The full modal displays progress bars, yield ranges (min/max), and confidence badges (high, medium, or low based on available data points).
IPM Spray Rotation PlannerOpen from the gear menu or Dashboard. Create named spray rotations with products from the IPM catalog, each with configurable day intervals. A 4-week calendar shows the color-coded spray schedule organized by product category (insecticide, miticide, fungicide, biological, organic, KNF). Tracks next due spray with overdue warnings. The Dashboard widget shows the next upcoming spray. Cross-references existing IPM logs for compliance tracking.
Light Map / PPFD GridOpen from the gear menu or Dashboard. Record PPFD readings at grid points across the canopy using a 3×3, 4×4, or 5×5 grid. Visualize results as an SVG color-coded heat map ranging from purple (low) to red (high). The stats banner shows average PPFD, min, max, and uniformity percentage (min/avg). Per-environment history allows comparing readings over time.
Water Source Quality LogOpen from the gear menu or Dashboard. Track source water parameters over time: pH, EC, TDS, alkalinity, chlorine, and temperature. An SVG trend chart shows dual pH/EC series with an ideal pH zone overlay (5.8–6.5). The stats banner displays averages and trend direction arrows. Supports 5 water sources: Tap, Filtered, Rain, RO, and Well.
Genetic Lineage TreeOpen from the gear menu or the 🌳 Lineage button on plant cards. The enhanced SVG family tree shows parent-clone relationships merged with breeding data. Full Genetics mode adds strain genetics subtitles, generation-colored node borders, breeding cross badges, father-plant reference arrows (dashed gold), and seed harvest count badges. Toggle between Simple (classic) and Full Genetics view. A legend explains all node types.
Unit ConverterOpen from the gear menu (Calculators group) or Dashboard. Convert between units across 7 categories: Weight (g, oz, lb, kg), Volume (mL, L, gal, fl oz, tsp, tbsp, cup), Temperature (°F, °C), Length (cm, in, ft, m), Area (ft², m²), EC/PPM (EC, PPM-500, PPM-700), and Light (lux, foot-candles, PPFD). Live bidirectional conversion with a swap button to reverse source and target units.
Pre-Grow ChecklistOpen from the gear menu (Growing group) or Dashboard. Choose from 4 built-in templates: Indoor Photoperiod (23 items), Indoor Autoflower (16 items), Outdoor (16 items), and Hydro/DWC (19 items). Items are organized by category (Equipment, Environment, Medium, Nutrients, Seeds & Genetics, Safety). Check off items as you prepare, track progress with a percentage bar, and add custom items. Save and reuse checklists for future grows.
Garden Stats & MilestonesA persistent counter on the Dashboard tracks every plant ever managed, even if deleted or archived. The Garden Stats card shows total plants managed, harvests, total yield, and days growing. Tap it to open the detailed stats modal with 8 metrics and a milestone ladder with achievement badges: Seedling (10), Gardener (25), Cultivator (50), Expert (100), Veteran (250), Elite (500), and Master Grower (1,000). A progress bar shows advancement to the next milestone.
Terpene & Cannabinoid ProfilesOpen from the gear menu (Growing group) or Dashboard. Log THC%, CBD%, and 10 terpene percentages (Myrcene, Limonene, Caryophyllene, Linalool, Pinene, Humulene, Terpinolene, Ocimene, Bisabolol, Eucalyptol) per harvest. Visualize results as an interactive 10-axis SVG radar chart. Tag effect profiles (Relaxing, Energizing, Creative, Focused, Euphoric, Sedating, Appetite, Anti-Inflammatory, Pain Relief, Anti-Anxiety), add aroma notes, and assign a quality score. Compare 2–3 profiles with overlaid radar charts.
Power Cost CalculatorOpen from the gear menu (Calculators group) or Dashboard. Estimate electricity costs from grow equipment specifications. Add equipment rows with name, wattage, hours per day, and quantity. The calculator provides live cost estimates: daily kWh, daily cost, monthly cost, and per-cycle cost based on your electricity rate (default $0.12/kWh, configurable). Save equipment profiles for reuse across grows.
Crop Steering TrackerOpen from the gear menu (Growing group) or Dashboard. Track generative vs vegetative crop steering strategies per plant. Log dry-back percentage, irrigation count, EC runoff, substrate moisture, and notes per session. View a trend chart with dual-axis (dry-back % and EC) and phase region shading. Phase reference cards show target ranges: Generative (dry-back 15–30%, EC 3–6, 3–4 irrigations) and Vegetative (dry-back 5–15%, EC 2–3.5, 6–10 irrigations).
Environmental RecipesOpen from the gear menu (Growing group) or Dashboard. Create reusable grow-stage environment target profiles with temperature, humidity, VPD, CO2, and light hour settings. Four built-in templates are included: Seedling (72–78°F, 65–75% RH), Vegetative (75–82°F, 55–65% RH), Flower (72–78°F, 45–55% RH), and Late Flower/Ripen (68–75°F, 40–50% RH). Create custom recipes, then apply any recipe to an environment for live actual-vs-target comparison with green (within range), yellow (slightly off), and red (far off) indicators.
Grow Journal ExportOpen from the gear menu (Reports group) or Dashboard. Generate a shareable standalone HTML grow diary for any plant. The export aggregates strain information, a chronological photo gallery, feeding log, IPM events, harvest results, and terpene profiles into a single printable document. The report opens in a new browser window, ready to print or save as an HTML file that can be opened in any browser without the app. On browsers that support navigator.share, a Share button in the top-right of the popup wraps the journal as a .html File and opens the OS share sheet for direct send to messaging / mail / cloud storage.
Open from the gear menu (Calculators group) or Dashboard. Select 2–3 strains to compare side-by-side using aggregated data from harvests, reviews, and expenses. The table shows harvests, plant count, average dry weight, total yield, quality, and review scores, plus a full cost breakdown: Cost (harvested), Lost (dead plants), Cost/Plant, and Cost/Gram. Every expense is split into direct (tagged to a plant) and shared overhead (spread equally across every plant grown); the “money lost” figure comes from plants you archive as Died or Culled. Lowest-cost values are highlighted, and a bar chart compares yield. See the FAQ “How are the plant costs in Strain Comparison calculated?” for the full method.
Photo Timeline ComparisonOpen from the gear menu (Reports group) or Dashboard. Select a plant, then click two photos from its journal to view them side by side with date labels and a days-apart indicator. Useful for visually tracking plant growth or comparing canopy development at different stages.
KNF Ferment TrackerOpen from the gear menu (Growing group) or Dashboard. Track active Korean Natural Farming ferments with 10 built-in types: FPJ (7 days), FFJ (90 days), FAA (90 days), OHN (30 days), LABS (7 days), IMO-3 (7 days), WCA (14 days), WCA-P (30 days), BRV (7 days), and Molasses Soil Drench (1 day). Each entry tracks start date, ingredients, expected duration, and notes. Live status badges show current state: gold (fermenting), green (ready to use), or orange (overdue). Mark ferments as used or delete when finished.
Companion Planting GuideOpen from the gear menu (Diagnostics group) or Dashboard. A reference guide for 15 companion plants organized into 4 filterable categories: Pest Repellent (Basil, Lavender, Peppermint, Rosemary, Garlic, Chrysanthemum), Trap Crop (Marigold, Nasturtium, Sunflower), Pollinator (Dill, Cilantro, Yarrow), and Soil Builder (Chamomile, Clover, Comfrey). Each plant card shows an emoji icon, description of benefits, specific pests repelled, and practical growing tips.
Nutrient Availability / pH ChartOpen from the gear menu (Diagnostics group) or Dashboard. An interactive visual chart showing which of 14 nutrients (N, P, K, Ca, Mg, S, Fe, Mn, B, Cu, Zn, Mo, Cl, Ni) are available, reduced, or locked out at any given pH. The SVG chart displays pH 3.0–9.0 on the x-axis with horizontal bars per nutrient: green for optimal availability, gold for reduced, and gaps for locked out. A draggable pH slider moves a cyan indicator line across the chart and updates the status summary in real time. Toggle between Soil / Organic and Hydro / Coco modes for different availability ranges. The tool auto-reads your latest logged pH from environment readings or feeding data to pre-fill the slider.
CO₂ Calculator & TrackingOpen from the gear menu (Calculators group) or Dashboard. A two-part feature for sealed-room CO₂ management. The calculator takes room dimensions (length, width, height in feet), current CO₂ PPM, target PPM, and injection rate (CFH) to compute CO₂ needed (cubic feet) and injection time (minutes). Growth stage presets fill the target: Ambient (400), Veg (800), Early Flower (1200), Peak Flower (1500), and Late Flower (1000). Save your defaults for quick reuse. The CO₂ tracking component adds a CO₂ PPM field to environment readings, log CO₂ levels alongside temperature and humidity. The calculator includes a CO₂ trend chart from your logged readings with reference lines at ambient and flower levels.
Batch FeedingOpen from the Feeding tab toolbar (📋 Batch Feed), the gear menu (Growing group), or Dashboard quick actions. Log one feeding for multiple plants at once. The modal shows an environment filter dropdown to narrow plants, a checkbox grid of plant cards (showing strain, stage, and environment), with Select All and Deselect buttons and a live count badge. Fill in the feeding details once (nutrient, amount, unit, water volume, pH in/out, EC in/out, notes) and submit to create individual feeding entries for every selected plant. Useful for feeding all plants in a tent the same nutrient mix without logging each one separately.
Data Management
All data is stored in your browser's localStorage under the key _trm_pm. This means data persists between sessions but is tied to the specific browser and device you use.
ExportGo to gear menu → Export Data to download a complete JSON backup. The file includes a checksum for integrity verification. Export regularly, it only takes a second and protects all your grow records.
Backup NudgeA passive 💾 indicator appears in the header when your last export is getting stale: amber at 14+ days (or never exported), red at 30+ days. Click it to jump straight to Export Data. Hides itself when backups are fresh or when you have no data yet to back up. The thresholds are configurable in source if you want them sooner or later.
Import (with diff preview)Go to gear menu → Import Data to restore from a JSON backup. Before anything is applied, a diff preview modal shows a per-category record count comparison (current vs backup, with Δ) across mothers, environments, clones, tasks, feedings, journal photos, IPM logs, harvests, strains, env readings, seeds, and health checks. Backup metadata (export date, app version) is shown at the top with a version-mismatch warning when applicable, and a red “heads up” appears if the backup contains fewer total records than your current data, protects against accidentally clobbering data with an older backup. Confirm to apply, Cancel to abort.
Undo via ToastDestructive actions (archive plant, archive environment, delete task, delete photo) skip the “Are you sure?” modal and run immediately. A 6-second toast appears in the bottom-right with an Undo button. Click Undo to restore the prior state; ignore it and the action persists. Faster, reversible, and respects your flow. The undo restores the full record snapshot including any associated activity-log entry.
Cloud Sync (Firebase)Tap the ☁ Cloud Sync button in the header to connect with Firebase. Cloud sync provides automatic backup and cross-device synchronization. Your data is encrypted and stored securely. Log in with your email to enable sync.
Restore from cloud uses the same diff preview modal as file imports: before any destructive overwrite, you see a per-category record-count comparison (current vs cloud backup, with Δ), the backup’s export date, a version-mismatch warning when applicable, and a red “heads up” if the cloud copy has fewer records than your current local data. Confirm with Restore from cloud to apply, Cancel to abort, you’ll never accidentally clobber your local data with an older cloud snapshot without seeing what’s about to happen.
Encrypted ExportsGo to gear menu → 🔒 Export Encryption to toggle encrypted exports on or off. When enabled, Export Data will prompt for a password and encrypt your backup using AES-256-GCM with PBKDF2 key derivation (SHA-256, 600,000 iterations). The export is saved as a .encrypted.json file. On import, encrypted files are auto-detected by their header and a password prompt appears. Unencrypted backups are always accepted regardless of this setting. A password strength indicator helps you choose a strong password. There is no password recovery, if you forget the password, the backup cannot be restored.
When you grow multiple plants of the same strain, the app automatically assigns numbers (#1, #2, #3) to each plant so you can tell them apart in every dropdown, feeding log, task list, chart, calendar, and notification. You can also set an optional Nickname in the Add/Edit Plant form (e.g. “Mom A”, “North Tent”, “Pheno 3”). Nicknames override auto-numbers and display as “Blue Dream, Yoda” across the entire app. The FleetView table includes a sortable Label column showing each plant’s nickname or number. Search also matches against nicknames.
Hawaiian Name SuggestionsClick the 🎲 dice button next to the Nickname field when adding or editing a plant to get a random Polynesian/Hawaiian name as a nickname. The app picks from 66 names drawn from Hawaiian mythology, aliʻi lineage, and nature (Pele, Lono, Kāne, Hiʻiaka, Leilani, Mahina, Lehua, Pikake, and more) and avoids names already in use by your active plants. Click again for a different suggestion, or type your own custom nickname.
Print & PDF ExportPlant Manager has a unified print stylesheet that applies to every Print / Save as PDF flow in the app: Plant Reports, Garden Reports, Grow Journal Export, Daily Snapshot, and QR plant tags. When you trigger any of these (or hit Ctrl+P on a tab), the print preview hides all chrome (header, nav, command palette, toasts, tip banner, hero, gear menu), flattens cards (white background, no shadows, no hover transforms), forces text to black, expands external link URLs after each <a> tag, applies sensible page-breaks (cards/rows/headings stay together), and uses a 0.6" page margin. Theme-agnostic, looks the same regardless of dark or light mode.
PWA Install
Plant Manager is a Progressive Web App (PWA). You can install it on your phone or computer for a native app-like experience, offline-capable, fullscreen, with its own home-screen icon. There are now three ways to trigger the install:
In-app install prompt (recommended)On Android Chrome / Edge and most desktop Chromium browsers, the app captures the browser’s install event and surfaces it directly. Plant Manager waits until you’ve done enough with the app to know whether you want it on your home screen, specifically, until you have 3+ plants or 5+ feedings logged (or 90 seconds of session time has elapsed, whichever comes first). At that point you’ll see a one-time toast at the bottom of the screen offering Install. Tap it to fire the native install dialog. You can also trigger the prompt on demand at any time from the gear menu → Install App or Command Palette → “Install App”.
iOS (Safari)iOS doesn’t expose an install event to web pages, so the app shows a one-time walkthrough modal on first launch that mirrors the native flow:
- Tap the Share button at the bottom of Safari
- Scroll down and tap Add to Home Screen
- Tap Add to confirm
You can re-open this walkthrough at any time from the gear menu → Install App.
Manual install (fallback)- Android Chrome, three-dot menu → Install app or Add to Home Screen
- Desktop Chrome/Edge, click the install icon in the address bar, or three-dot menu → Install Tropical Roots Maui - Plant Manager
- iOS Safari, Share button → Add to Home Screen (same as the walkthrough above)
The app opens in its own window without browser chrome and works offline thanks to the service worker cache. The About dialog (tap the version chip in the footer) will show an · installed PWA marker so you can confirm you’re running the installed copy. Home-screen shortcuts are also available: long-press the app icon on Android to get quick-launch entries for Quick Water, Add Plant, and Daily Snapshot.
Receive shared photos (Android share target)Once installed, Plant Manager appears in the Android system share sheet for any image. Snap a photo with the Camera app, hit Share, pick Plant Manager from the list, and the photo lands pre-attached in the Add Journal Photo modal, just pick the plant, optionally tag a growth stage, and save. The service worker handles the share POST under the hood and the photo is consumed exactly once, so a normal reload won’t re-import it.
Open .json backups in the installed appThe installed PWA also registers as a handler for application/json files. On Android (and Chromium ≥ 102 on desktop), tapping a Plant Manager backup in the Files app launches the installed app with the file pre-loaded into the Import flow. The launch handler reuses the running window when one exists, so opening a file won’t spawn a duplicate.
When Plant Manager ships a new version, the service worker downloads it in the background. Once the update is ready, you’ll see a passive "A new version is available" toast with a Reload action. The toast is sticky, it stays visible until you click Reload, so it never interrupts mid-form work. Click when you’re ready and the page reloads with the fresh shell.
Accessibility Features
Plant Manager is built to work for people who navigate by keyboard, screen reader, reduced-motion preference, or high-contrast vision. Specifics:
Keyboard NavigationEvery interactive element is reachable via Tab. Focus is indicated by a 2px cyan outline that matches the brand (visible only via :focus-visible, so it doesn’t appear on mouse clicks). Tab dropdowns and the command palette can be operated entirely from the keyboard, see the Keyboard Shortcuts section for the full layer.
The first focusable element on every page is a hidden Skip to main content link. Press Tab on first load to reveal it; Enter jumps focus past the header and tab nav directly to the dashboard content. Useful for keyboard and screen-reader users who don’t want to walk through navigation links every page.
Screen Reader SupportIcon-only buttons (gear, weather, moon, cloud-sync, theme-toggle, modal-close, backup-nudge) all carry aria-label attributes describing their purpose. The toast container has role="status" with aria-live="polite" so success and error messages get announced. The settings menu has aria-haspopup and aria-expanded that update as it opens and closes. Top-level landmarks use semantic <header role="banner">, <nav role="navigation">, and <main role="main">.
All modal dialogs in the app (forms, confirms, calculators, the photo lightbox, command palette, About, Changelog viewer) carry role="dialog", aria-modal="true", and aria-labelledby pointing at the modal title so screen readers announce them correctly. A focus trap keeps Tab and Shift+Tab cycling inside the open modal so keyboard users can’t accidentally tab out into background content. On open, focus moves to the first form field (or the first action button if there are no fields); on close, focus is restored to whatever element opened the modal, so keyboard users continue right where they left off instead of being dumped at the top of the page.
If your operating system sets prefers-reduced-motion: reduce, Plant Manager honors it. All transitions are reduced to near-instant, hover-lift effects on cards are disabled, the stat-card icon scale-rotate animation is disabled, the fadeUp panel-transition is disabled, and the pulse animation is disabled. The cyan focus ring still works.
On devices that support navigator.vibrate, Plant Manager fires a brief tactile pulse on a couple of key actions so the interaction feels physical: a 10ms tick when you press Undo on a toast (so the undo lands before the toast fades), and a 15ms tick when you mark a task as complete. No-op on desktop and on devices where the OS blocks vibration; the parent action runs identically either way.
Body text and secondary text both pass WCAG AA contrast ratios on small body copy in both dark and light themes. Tertiary/dim text (used for captions, timestamps, metadata) sits at the AA threshold and is bumped from earlier versions to ensure readability.
Reporting IssuesIf you hit a screen reader, keyboard, or contrast issue that this section doesn’t cover, the GitHub repo accepts accessibility reports as issues: github.com/magikh0e/PlantManager/issues. Tag with the a11y label.
Privacy & Search Indexing
Plant Manager contains no third-party analytics scripts, no advertising, no tracking pixels, and no telemetry. The developer cannot see which features you use, when you use them, or how often. Optional integrations (Cloud Sync, Weather, Pest Identification) are off by default and use credentials you supply (your own Firebase project, your own Google Vision API key). The About dialog (tap the version chip in the footer) restates this posture in-product so it’s never more than one tap away.
Where Your Data LivesAll cultivation records (plants, feedings, photos, harvests, IPM events) are stored in your browser’s localStorage on your own device. Nothing is uploaded to a developer-operated server. If you enable Cloud Sync, data flows directly between your device and your own Firebase project, the developer never sees it. If you use the Pest Identifier, the specific photo you submit goes to Google’s Vision API for that single request, billed against your own API key.
Plant Manager’s pages embed JSON-LD structured data conforming to schema.org standards (WebApplication, SoftwareApplication, Article, BreadcrumbList, Organization) so Google can index the app and supporting pages with rich results. Once Play Store reviews accumulate, an AggregateRating schema block surfaces star ratings directly in Google search snippets. Plant Manager doesn’t use the deprecated FAQPage or HowTo schemas (Google removed those rich-result types in 2023).
The full privacy policy is available at /privacy-policy.html. It documents the “no server, no analytics, no ads” posture and the optional integrations in detail. Required for the Play Store listing and accurately describes the app’s actual behavior.
Power-user shortcuts
Plant Manager has a full keyboard layer for users who prefer not to reach for the mouse. None of these shortcuts fire while you’re typing in a form field, so you can ignore them entirely if you don’t want them.
Command PalettePress Ctrl+K (or Cmd+K on Mac), or just /, to open a fuzzy-search launcher covering 80+ commands across navigation, quick-add forms, calculators, growing tools, diagnostics, reports, tags, and settings. Type any partial keyword (try “feed”, “vpd”, or “harvest”) to filter. Multi-word queries match across the command name, keywords, and section. ↑/↓ arrows navigate the result list, Enter activates the selected command, Esc closes the palette. The palette is also reachable via the 🔍 Search Commands entry pinned to the top of the gear menu.
Useful global utility commands that don’t correspond to any tab:
- Install App, fires the native install prompt (Android/Chrome) or the iOS Add-to-Home-Screen walkthrough
- About Plant Manager, opens the About dialog with version, GitHub, license, and links to What’s New / Full Changelog / Help
- Show What’s New, replays the release-notes popup for the current version
- View Changelog, renders the full
CHANGELOG.txtin a styled in-app modal (version dividers, FEATURE/POLISH/FIX section labels, scrollable history back to v1.0.0) - Run Setup Wizard, replays the first-run wizard at any time, even after you’ve dismissed it
- Toggle Theme, cycles Dark → Light → Auto without leaving the keyboard
- Copy Demo Share Link, copies the
?demosharable URL to the clipboard
Press ? at any time (outside a form field) to open a modal listing every keyboard shortcut available in the app. Useful when you forget a binding or want to discover ones you haven’t tried.
Context-Aware NewPress n to open the “new” form for whatever tab you’re currently on:
- Plants, opens Add Mother Plant
- Clones, opens Log Clones
- Strains, opens Add Strain
- Tasks, opens Add Task
- Feeding, opens Log Feeding
- IPM, opens Log IPM Issue
- Journal, opens Add Photo
- Harvest, opens Log Harvest
- Environs, opens Add Environment
- Readings, opens Log Environment Reading
- Dashboard / Calendar / Analytics, falls back to Add Mother Plant or Add Task
Press g and then a letter (within ~1.5 seconds) to jump to a section of the app:
- g d, Dashboard
- g p, Plants
- g c, Tasks (Care group)
- g r, Journal (Records group)
- g i, Readings (Insights group)
Esc closes any open modal, dialog, the photo lightbox, the command palette, or an open tab dropdown. Clicking outside the modal/palette has the same effect.
URL ShortcutsPlant Manager also accepts a few URL parameters for direct access without going through the UI:
?demoor#demo, auto-loads the demo data fixture on page load. Existing-data users get a confirm prompt before anything is added. Useful for sharing a preview link with friends.?action=quickwater, opens the Quick Water modal directly. Used by the “Quick Water” home-screen shortcut on Android (long-press the launcher icon).?action=addplant, opens the Add Mother Plant form directly. Used by the “Add Plant” home-screen shortcut.?action=snapshot, generates today’s Daily Snapshot directly. Used by the “Daily Snapshot” home-screen shortcut.
All special URL parameters are stripped via history.replaceState after they fire, so a normal reload won’t re-trigger them.
Common Questions
The most-asked questions about Plant Manager, tap any question to expand the answer.
Where is my data stored, and is it private?
Will I lose my data if I clear my browser cache?
Export Encryption to password-protect your backups.
Is Plant Manager free to use?
I loaded demo data. How do I clear it out now that I'm tracking real plants?
_demo:true. To remove all demo records without touching your own data, you have three options: (1) click Clear demo data in the banner that appears at the top of the dashboard when demo records are detected, (2) open the gear menu and click 🧹 Clear Demo Data, or (3) hit Ctrl+K and search for "clear demo." All three paths show the same confirmation modal listing the per-category record counts that will be removed before deleting anything. Records you've added yourself are preserved.
I dismissed the demo banner with "Keep mixed." How do I get it back?
demoBannerDismissed flag and the banner reappears on the dashboard next time you visit. Alternatively, just clear demo data directly from the gear menu, the banner is no longer relevant once demo records are gone.
How does Plant Manager compare to other grow tracker apps?
How are the plant costs in Strain Comparison calculated?
For each strain those per-plant costs are then grouped by what happened to the plant:
- Cost (harvested), total cost of the plants that actually produced a harvest.
- Lost (dead plants), money spent on plants you archived as Died or Culled that never yielded, your sunk cost.
- Cost/Plant, the strain's total cost divided by every plant of that strain (harvested, dead, retired, or still growing).
- Cost/Gram, the cost of the harvested plants divided by their total dry weight. Dead-plant losses are shown separately, not baked in.
Note: the Cost per Gram by Strain chart on the Analytics tab uses a simpler method, it splits shared overhead by each strain's share of total yield rather than per plant, so its $/g figure can differ slightly from the one in Strain Comparison.
Does Plant Manager work offline?
How do I install Plant Manager on my phone?
Can I sync data between my phone and computer?
- Manual: Export a JSON backup from one device, import it on the other via the gear menu.
- Automatic: Enable Cloud Sync with your own Firebase project to keep multiple devices in sync. Encryption is optional on both manual exports and cloud backups.
How do I differentiate multiple plants of the same strain?
Can I encrypt my data exports?
.encrypted.json file. Encryption uses AES-256-GCM with PBKDF2 key derivation (600,000 SHA-256 iterations) for brute-force resistance. On import, encrypted files are auto-detected and prompt for the decryption password. Password recovery is not possible, store your password somewhere safe.
Which devices and browsers are supported?
- Mobile: iOS Safari 14+, Android Chrome, Brave, Firefox
- Desktop: Chrome, Edge, Firefox, Safari, Brave
- Installable as a PWA on all of the above
How accurate is the harvest yield estimate?
Can I print plant tags for the grow room?
- Single tag: Open any plant card → "More" dropdown → QR Tag
- Batch: Gear menu → Tags & Labels → Print Plant Tags / Clone Tags / Breeding Cross Tags
- Reports: Plant Report PDF includes a tag for hand-off or archiving